Phet Colorado is an interactive site full of many science simulations which engage and stimulate student learning. The main webpage http://phet.colorado.edu/ it is based out of the University of Colorado at Boulder.
If you have not used the site do it has science simulations for every discipline. I strongly recommend, My Solar System, Faraday's Electromagnetic Lab, Pendulum Lab, Calculus Grapher, and The Moving Man.
My Solar System
http://phet.colorado.edu/en/simulation/my-solar-system
Faraday's Electromagnetic Lab
http://phet.colorado.edu/en/simulation/faraday
Lab, Pendulum Lab
http://phet.colorado.edu/sims/pendulum-lab/pendulum-lab_es.html
Calculus Grapher
http://phet.colorado.edu/en/simulation/calculus-grapher
The Moving Man
http://phet.colorado.edu/en/simulation/moving-man
This web page is based on The Moving Man tool, it provides a lesson and additional resources to to scaffold the ideas of position versus time graphs and velocity verses time graphs in addition it provides acceleration versus time graphs. The Moving Man tool provides a great visual way of understanding the vector properties of displacement or position, velocity, and acceleration.
The Moving Man tool provides a interactive setting for students to tinker with motion and the laws of motion. It visually illustrates how position, velocity and acceleration are related. A student can click on the image of the man at the top of the page and the simulation will record his movement graphing position, velocity, and acceleration vs. time. The record feature allows student to store and replay runs. There is a step feature that lets student step through the recorded run one step at a time.
There are three special features I recommend using. The expression evaluator allows students to enter in equations of motion to be tested. The direction can be indicated for the velocity and acceleration by clicking on the lower right box under vectors. This lets students know that velocity and acceleration are vectors and not scalar quantity’s requiring magnitude and direction. Lastly the motion can be expanded by selecting special features, free range. This is a great added feature because it lets students graph distances over 10 meters. Later on in this page students will plug in actual data from a 100 meter run. With this feature students can analyze this data graphically with position, velocity and acceleration versus time graphs.
Introduction:
Trick question: Does a negative velocity mean that an object is slowing down? Or does is it indicating direction?
Objective:
- Students will be able to graph position vs. time graphs.
- Students will be able to graph velocity vs. time graphs.
- Students will be able to make a story for position vs. time graphs and velocity vs. time graphs.
- Students will identify differences between a negative velocity and when an object is slowing down.
Professional Teacher Standards:
Teacher Standard 1.4-1.5: Support oral & written development
Teacher Standard 2.1-2.2 Develop understanding of number system sense
Teacher Standard 7.1-5 Teacher is skilled & knowledge in technology using it to support enhance learning
Colorado Model Content Standards:
Standard 1: Oral Expression and Listening,
Standard 4: Students apply thinking skills to their reading, writing, speaking, listening, and viewing.
Standard 6: Students read and recognize literature as a record of human experience.
Science Standard Physical Science 1.1 Newton’s laws of motion and gravitation describe the relationships among forces acting on and between objects, their masses, and changes in their motion – but have limitations.
Match the word problems with the picture problems:
Three pictures problems:
Describe the motion of each car moving to the right. The strobe pictures were taken every 3 s (seconds).

Describe the motion of the billiard ball. The strobe pictures were taken at regular interval for this problem assumes that it was every 3s (seconds).

Three word problems:
- I was out on a stroll wearing my portable CD player. The music had a good beat which helped me keep a steady pace. I did not speed up or slow down. I just kept on moving to the beat of the music.
- I start a little slower because was on a gravel road and I speed up on the new section of road, and then reduce my speed even more because I hit the old worn down road.
- I started running slow but then increased my pace throughout the entire run.
Match the word problems and picture problems with a position graph and the velocity graph below:

Figure 1

Figure 2

Figure 3

Figure 4

Figure 5

Figure 6
Use the http://phet.colorado.edu/en/simulation/moving-man web page to help you match each position graph with its velocity graph.
Explore the play, pause, and reset all buttons.
The Link is: http://phet.colorado.edu/en/simulation/moving-man
From the previous class you have data from a hundred meter race; you used a stop watch to get a time for every 10 meter interval of a hundred meter race.
Fill out the table on you lab notebook for each interval as shown below:
|
Position: (M)
|
Runner
|
0.00
|
10.00
|
20.00
|
30.00
|
40.00
|
50.00
|
60.00
|
70.00
|
80.00
|
90.00
|
100.00
|
|
Time: (S)
|
Bob
|
0.00
|
1.75
|
3.56
|
4.78
|
6.41
|
7.66
|
9.68
|
10.99
|
12.37
|
13.25
|
15.46
|
|
Time: (S)
|
Jim
|
0.00
|
1.92
|
3.81
|
4.91
|
6.31
|
7.16
|
8.72
|
10.18
|
11.75
|
13.03
|
15.04
|
|
Time: (S)
|
Ben
|
0.00
|
2.66
|
4.86
|
6.16
|
8.31
|
10.35
|
12.35
|
14.32
|
14.93
|
18.90
|
21.62
|
|
Time: (S)
|
Chris
|
0.00
|
2.09
|
3.30
|
4.53
|
5.88
|
7.34
|
8.28
|
10.80
|
11.10
|
12.86
|
14.28
|
For additional resources complete the student excel document and compare it later to The Moving Man.
Running Template lesson student.xlsx
Running Template student.xlsx
Find the average velocity of each run and the average velocity for each interval of ten meters use the equation below to help:
Average velocity is:

|
|
0
|
10
|
20
|
30
|
40
|
50
|
60
|
70
|
80
|
90
|
100
|
Average: Velocity:
|
|
BOB
|
Velocity: (M/S)
|
0
|
5.7
|
5.5
|
8.2
|
6.1
|
8
|
5.0
|
7.6
|
7.3
|
11
|
4.5
|
6.47
|
|
Jim
|
Velocity: (M/S)
|
0
|
5.2
|
5.3
|
9.1
|
7.1
|
11.
|
6.4
|
6.9
|
6.4
|
7.8
|
5.0
|
6.65
|
|
Ben
|
Velocity: (M/S)
|
0
|
3.8
|
4.6
|
7.7
|
4.7
|
4.9
|
5.0
|
5.1
|
16
|
2.5
|
3.7
|
4.63
|
|
Chris
|
Velocity: (M/S)
|
0
|
4.8
|
8.3
|
8.1
|
7.4
|
6.8
|
11
|
4
|
33
|
5.7
|
7.0
|
7
|
Table 1
Graph the displacement vs. time and compare it to the graph below.

Once you have a velocity enter it into the moving man simulation and see what the graph looks like for each value. To enter it in properly you can right click on under velocity and plug in a value. Close the graphs for acceleration and position. The screen should look like the picture below, figure 7.

Figure 7: http://phet.colorado.edu/en/simulation/moving-man
- Make sure to press the close sign on the box on the bricks so you record positions over 10 meters.
(Or click using special features, free range)
- Pause at each time interval that was recorded for each stop watch for every 100 meter interval.
- Plug in a new velocity according to what you found average velocity and recorded in table 1.
- Print the screen and see what the velocity vs. time graph looks like. (See picture below for Bob’s velocity vs. time graph)
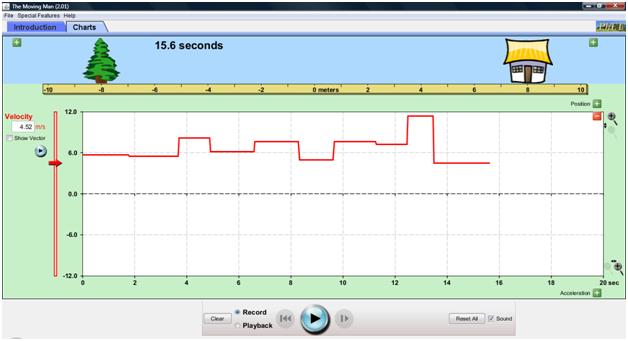
Figure 8: http://phet.colorado.edu/en/simulation/moving-man
Problem 1

A motion detector was used to generate the graph above how was it done? Write a story in you lab notebook of how you could create a graph like this.- Use The Moving Man to create the position vs. time and velocity vs. time graphs to check your answer.
Problem 2

- A motion detector was used to generate the graph above how was it done? Write a story in you lab notebook of how you could create a graph like this.
- Use The Moving Man to create the position vs. time and velocity vs. time graphs to check your answer.
Problem 3

- A motion detector was used to generate the graph above how was it done? Write a story in you lab notebook of how you could create a graph like this.
- Use The Moving Man to create the position vs. time and velocity vs. time graphs to check your answer.
- Record a velocity vs. time graph for the position vs. time graph in you lab notebook.
References:
A. Colorado Department of Education (2009) State Standards. Retrieved 7/23/10 from http://www.cde.state.co.us/cdeassess/UAS/AdoptedAcademicStandards/Science_Standards_Adopted_12.10.09.pdf
B. Serway, R. and Faughn, J. (1999). Holt Physics. South Capital of Texas Highway, Texas. Austin.
C. Tipler, P. (1999). Physics for Scientists and Engineers Fourth Edition. Madison Ave, NY. New York.
D. Eisenkraft, A. (2005). Active Physics An inquiry Approach to Physics. Armonk, NY.
E. Loeblein, T. and Leon, M. The Moving Man. PHET Colorado Retrieved, 10/17/10 from http://phet.colorado.edu
Comments (0)
You don't have permission to comment on this page.